
CUTD User Manual
Find a codon usage table, understand its values, compare taxa and download the underlying data.
The current catalog contains 2,192 TaxIDs and 7,040 tables, with data version CUTD-v0.1[beta]. The Classic Tables page displays precomputed tables for the exact TaxID you select.
Quick start
Find your first table
- Open Classic Tables.
- Enter a TaxID, such as 9606, or a scientific name, such as Homo sapiens.
- Choose a suggestion. For a complete TaxID or full catalog name, you can also press Search or Enter.
- Select an available Compartment and Source. The usual starting selection is nuclear/genomic, its main genetic code and All sources.
- Switch between Table, Heatmap and Share, or download CUTG text, TSV or JSON.
Compare two taxa
- Open the first taxon’s table and set Source to All.
- Choose an amino acid in Codon ranking.
- Enter the second taxon’s numeric TaxID in Compare with, for example 10090 for Mus musculus. Choose a suggestion or press Enter for an exact TaxID.
- Read the paired codon shares and their percentage-point differences. Use Clear comparison (×) to return to a single taxon.
Comparison uses All versus All, for different TaxIDs with the same genetic code. The app prefers the same compartment when available. The comparison input is disabled for TRA, TSA, WGS and RefSeq; switch Source back to All to compare taxa.
Classic codon usage tables
Search and browse
Type part of a TaxID, scientific name or catalog common name to filter the directory and show suggestions. Choose a suggestion to open its table. Search or Enter without a highlighted suggestion requires an exact TaxID or a full catalog name; a partial name only narrows the matches. Use the up/down arrow keys and Enter to choose a suggestion, or Escape to close the list.
The directory is alphabetical. Use Previous and Next to browse its pages; each entry links to an All-source table. Searching opens the nuclear compartment when available, otherwise the compartment with the most CDS. It selects All when available, otherwise an available source.
A taxon page covers that exact TaxID. It does not combine descendants of a taxonomic group. Escherichia coli and Escherichia coli K-12 are separate entries. The organism name opens its DDBJ TXSearch entry and the NCBI Taxonomy link opens NCBI Taxonomy; hover over or focus the lineage to read its full path.
Select a source
| Source | Meaning |
|---|---|
| TRA | DDBJ Traditional Data: conventional sequence records, including records in the TSA division but excluding standalone TSA projects. |
| TSA | Transcriptome Shotgun Data: CDS from standalone TSA projects. |
| WGS | Whole Genome Shotgun Data: CDS annotated on genome assemblies. |
| RefSeq | NCBI Reference Sequence collection. |
| All | Distinct CDS sequences across the available source sets. A sequence represented in multiple sources is counted once. |
All is not the sum of TRA, TSA, WGS and RefSeq. Source sets can overlap. All and RefSeq can be identical when a table’s underlying collection contains only RefSeq CDS.
An unavailable source is disabled; it does not represent zero counts. The information icon beside Source links to this section.
Compartment and genetic code
Use Compartment to select an available nuclear/genomic or organelle table. Changing compartment selects its main genetic code. The current source is retained when available; otherwise the selection returns to All. Separate code tables appear only where additional code-specific tables exist.
The genetic code determines each codon’s amino-acid interpretation. For example, TGA is a stop under codes 1 and 11, and Trp under code 4. Check the table’s code before interpreting its fractions, heatmap or comparison.
The Genetic Codes lists reference links to DDBJ explanations for codes represented in this taxon’s tables. These links open reference pages; use Compartment or Separate code tables to change the table itself.
Read the 64-codon table
Table contains all 64 codons in the standard codon-table layout used by CUTG, grouped by their second base. The default All fields layout shows the codon, amino acid, fraction, frequency per thousand and count in parentheses. RSCU is available from the Displayed values selector and in cell details.
The screenshots below were captured on 11 November 2026 using Homo sapiens (TaxID 9606), nuclear, code 1, Source All and T notation. The comparison example adds Mus musculus (TaxID 10090). Select an image to enlarge it over the manual. Actual size shows its full resolution; close the preview with ×, Escape or a click on the background.
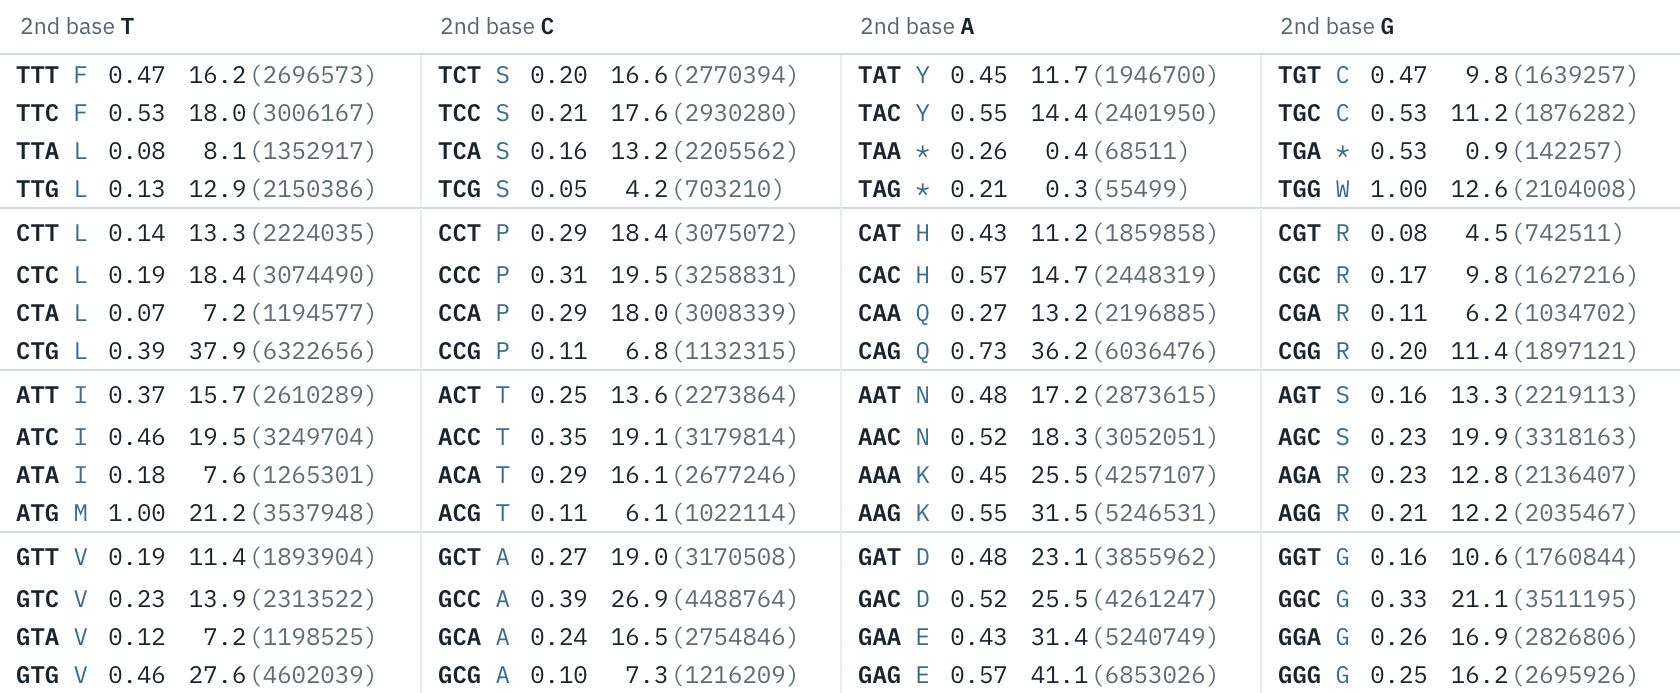
Table view: fraction, frequency per thousand and count.
| Value | How to read it |
|---|---|
| Count | Number of occurrences of the codon in the selected distinct-CDS set. |
| Frequency ‰ | Codon count per 1,000 codons, including stops in the denominator. |
| Fraction | The codon’s share within its amino-acid family under the selected genetic code. |
| RSCU | Relative synonymous codon usage: fraction multiplied by the number of codons in that amino-acid family. Stop RSCU is undefined and displayed as a dash. |
| Coding GC | G+C as a percentage of bases across the counted codons. |
| 1st / 2nd / 3rd letter GC | G+C at each codon position. These include stops; 3rd letter GC is GC3, not GC3s restricted to synonymous sites. |
Frequency(c) = count(c) / total_codons × 1,000
Fraction(c)  = count(c) / sum of counts in its amino-acid family
RSCU(c)      = Fraction(c) × number of synonymous codons  (sense codons)
The value selector is available in Table only; it is hidden in Heatmap and Share. Returning to Table restores your selected value. T / U changes displayed nucleotide notation; downloads retain canonical T.
Hover over or focus a codon to inspect its values. Arrow keys move between codons. On a narrow screen, scroll the table horizontally to see all codons.
Read the RSCU heatmap
Select Heatmap to color codons by RSCU. RSCU = 1 is the equal-usage expectation within an amino-acid family. Cells use a continuous log₂(RSCU) scale: white at 1, petrol below 1 and rose above 1, reaching full color at ≤0.5 and ≥2.
Stops and amino acids with a single codon under the selected genetic code have a gray hatch. Under the standard code, the single-codon amino acids are Met and Trp; other codes can have different families. Gray does not mean zero occurrences. Color clipping affects the display only; cell details and downloads retain the original values.
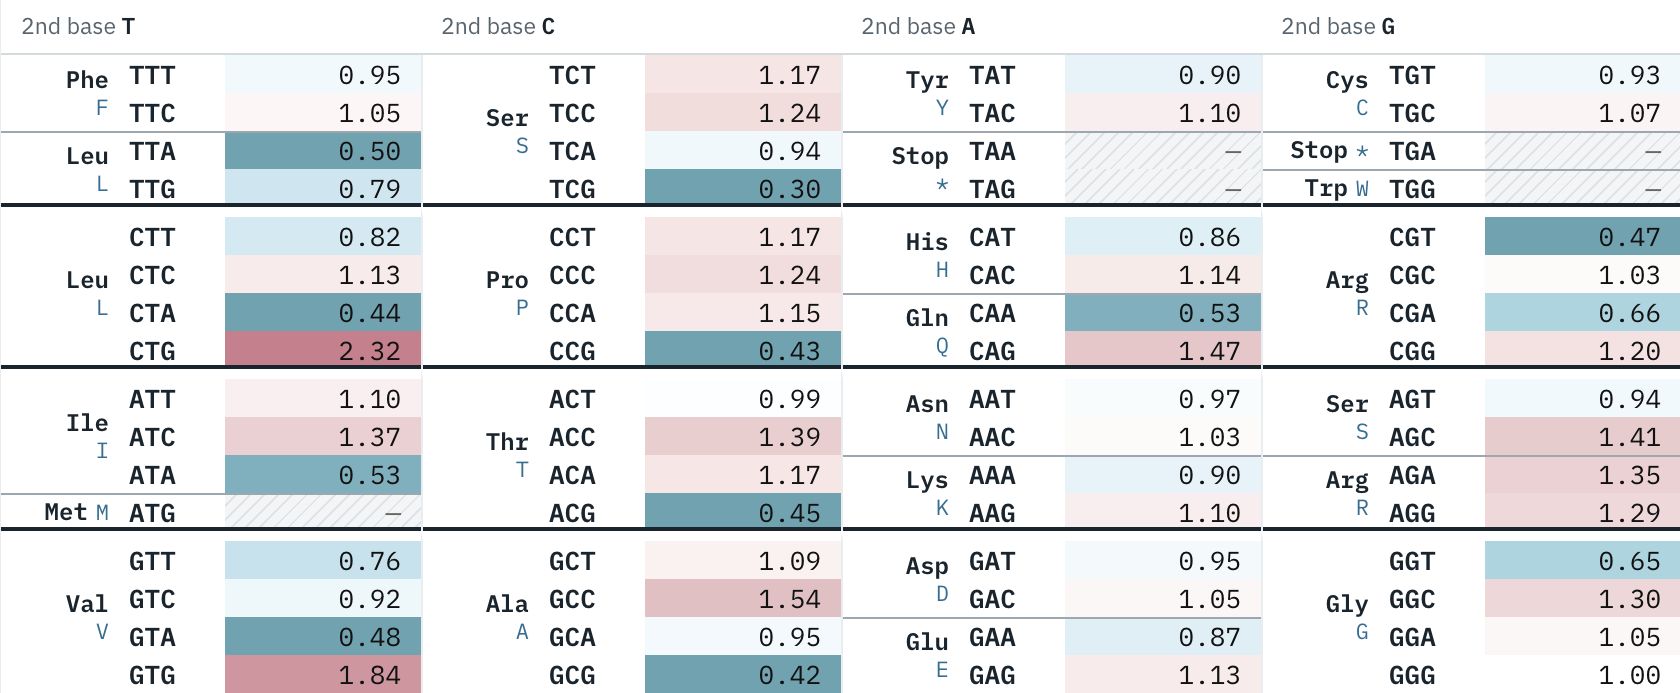
Heatmap: RSCU colors, with a gray hatch for stops and single-codon families.
Read synonymous shares
Select Share to see one bar per amino-acid family. Each observed family’s bar spans 100%; segment widths are its codons’ fractions, sorted from largest to smallest. Labels show fractions from 0 to 1, rather than frequencies per thousand.
Color indicates the third base: G/C-ending versus A/T-ending (A/U-ending in U notation). It does not indicate RSCU. Single-codon families and stops appear after the multi-codon sense families. If a family has no observed counts, its row is marked not observed rather than presenting equal segments as measured shares.
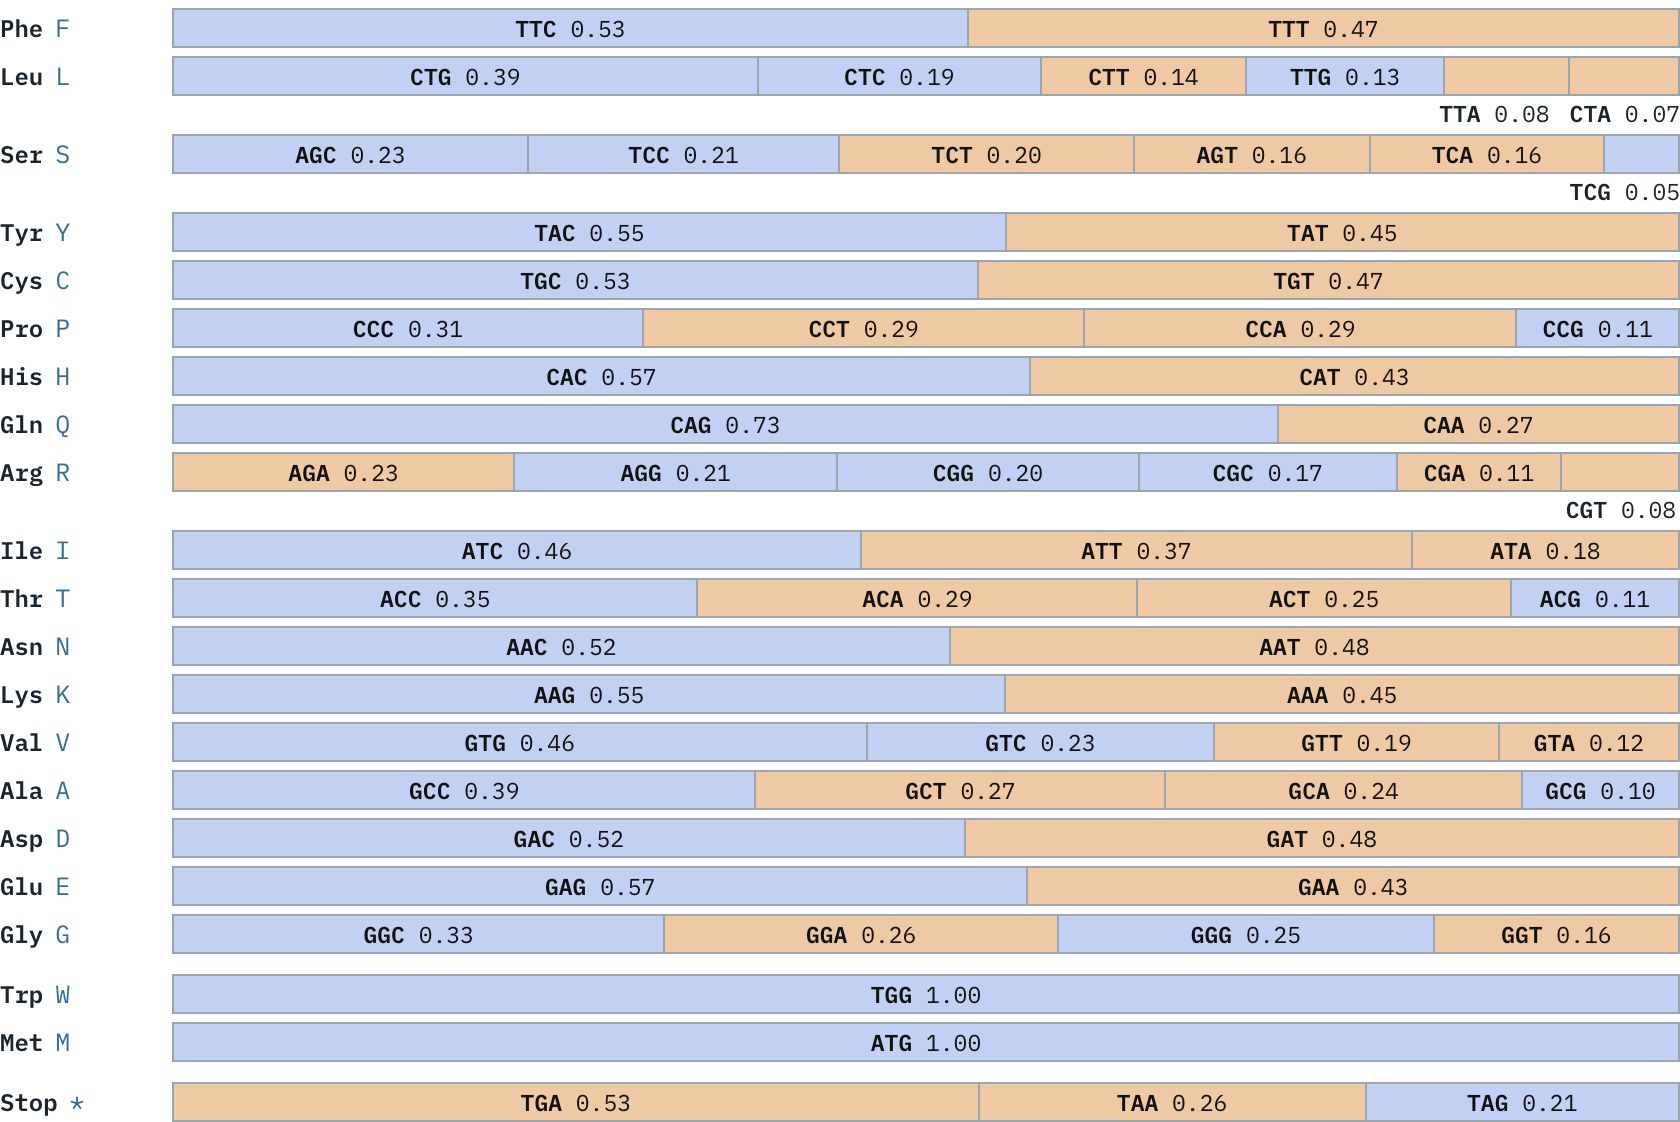
Share view: within-family fractions, colored by the third base.
Ranking and comparison
Choose an amino acid to rank its codons by their within-family shares. Ranking values are percentages; the order follows the primary table, including during comparison. Click a codon label to locate it in the current Table, Heatmap or Share view.
Compare with accepts a numeric TaxID, with suggestions for matching digits. Comparisons require different TaxIDs and All tables under the same genetic code. A target without a compatible All table is unavailable. The app prefers the primary table’s compartment, then uses another compartment with the same code if needed. Check the compartment when comparing organelle tables.
Paired bars show the primary and comparison shares. Δ (pp) = comparison share − primary share, using the displayed percentages rounded to one decimal place. A positive value means the codon has a larger within-family share in the comparison taxon.
Overall difference compares the complete 64-codon distributions, including stops. It is half the summed absolute differences of the count-based codon proportions, expressed as a percentage: 0% means identical distributions and 100% means no codon is shared. It has a different denominator from the amino-acid ranking bars. The comparison legend also shows each table’s CDS count and GC3.
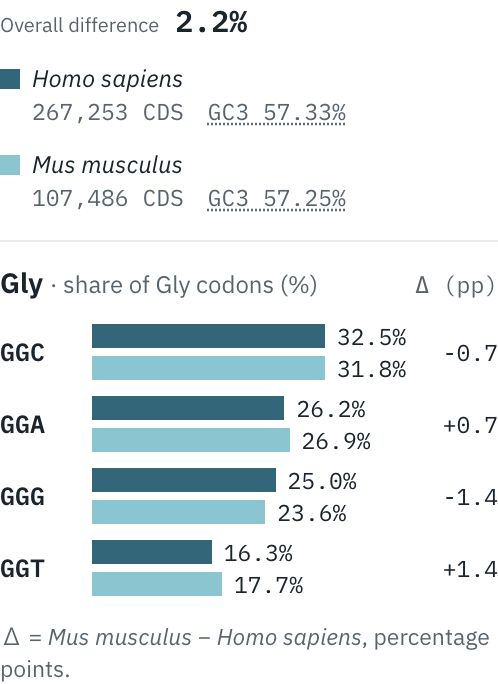
All-source comparison: Homo sapiens versus Mus musculus. Δ is comparison minus primary, in percentage points.
Across sources
Across sources compares TRA, TSA, WGS and RefSeq within the current taxon’s nuclear compartment and genetic code. It appears when an All reference table and at least two source tables with matching codon-to-amino-acid assignments and at least 100 CDS each are available. Loaded sources below this threshold or with incompatible assignments show a reason instead of percentages. Absent sources have no row. Organelle tables do not show this panel.
Each percentage is 100 × codon count / amino-acid family count within that source. Max − min (pp) is the largest minus smallest eligible source share, computed before display rounding. All is a separate reference row and does not enter this range.
The panel highlights up to two codons from different multi-codon sense families: the codon with the largest range from each family, then the two largest family representatives. Ties follow codon alphabetical order. If even one eligible source has no counts for a family, that family’s range is undefined and it is not ranked. Click a highlighted codon heading to locate it in the main view.
Source sets can overlap, so All is a deduplicated union. These differences describe source sensitivity; they are not a quality score or a statistical significance test. The current panel checks table identity, code assignments and CDS counts; it does not verify matching upstream batches or filtering rules.
The panel’s TSV lists every codon of the amino acids with two or more codons, for each compared source and then All: source, cds, codon, amino_acid, count, percent and resource. percent is the codon’s share of its amino acid in that source, with four decimals; it is blank when that amino acid has no codons in the source. Excluded sources, stops and single-codon amino acids are not included. The file is the same for every Source of the taxon.
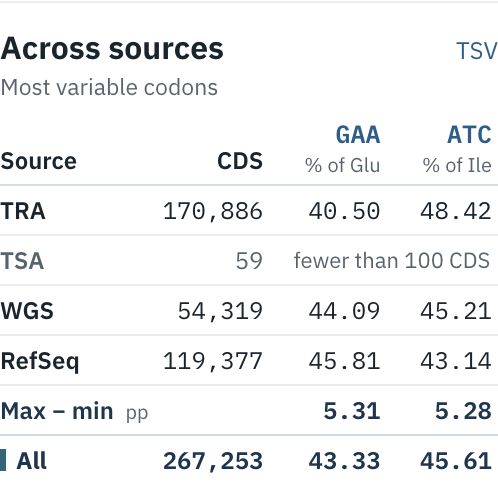
Across sources: eligible source shares, their range and All as a reference.
Composition
Composition summarizes the currently selected table and Source. The default Amino acids view shows each represented amino acid’s percentage of sense codons, excluding stops from the denominator. Bars share one scale. The assignments follow the selected genetic code; they describe codon counts rather than measured protein abundance.

Amino-acid composition: percentages of sense codons.
Codon positions shows A, C, G and T at positions 1, 2 and 3. Each row pools all codon counts, including stops, and sums to 100% before display rounding. It is weighted by codon counts rather than an average of per-gene percentages. T/U changes labels only.

Codon-position composition: base percentages at each position, including stops.
Hover over or focus a bar for counts and denominators. You can switch the two Composition tabs with the left/right arrow keys, Home or End.
The panel’s TSV downloads both composition views of the current table together, whichever tab is selected: part (amino_acid, position_1, position_2 or position_3), item, count, percent and resource. Amino-acid percentages are of sense codons (stops excluded); position percentages are of all codons. Percentages have four decimals; each part sums to 100 before rounding.
Download and share
| Action | Result |
|---|---|
| CUTG text | Plain-text table in the CUTG layout with all 64 codons, rounded fractions and frequencies, exact counts and GC summaries. The first line reads Species [TaxID_compartment_codeN_Source]: n CDS's (n codons), as CUTG readers expect. |
| TSV | A plain table with the header on the first line, read as is by spreadsheets, R and Python: all 64 codon rows with codon, amino_acid, count, per_thousand, fraction, rscu and resource. count is exact; per_thousand, fraction and rscu have six significant digits; rscu is blank for stop codons. |
| JSON | The data version (resource, the first key), the table identity, CDS and record totals, GC values in percent and all 64 codon rows with codon, amino_acid, count, per_thousand, fraction and rscu. count is exact; GC, per_thousand, fraction and rscu have six significant digits; rscu is null for stop codons. |
| API | Not available yet. |
| Copy link | Copies the table URL with the selected view, amino acid, T/U notation, Table value and comparison TaxID. The Composition tab is not saved. |
The main downloads always describe the primary table, independent of Table, Heatmap, Share or a comparison selection. Composition and Across sources have their own TSV controls. Downloads use T notation even when U is displayed. Every downloaded file states the data version in its content: the last line of the CUTG text, the resource column of a TSV and the first key of the JSON. File names stay the same across data versions. When an amino acid has no codons in the table, its fraction and rscu are undefined (0/0): blank in the TSV, null in the JSON and — on this page. The CUTG text prints 0.00 there because the CUTG layout allows only numbers; the count (0) shows the gap.
Organism names follow the NCBI Taxonomy used for each data version. NCBI writes a genus in square brackets, as in [Clostridium] symbiosum, when it considers that the species does not belong to that genus. In the CUTG text title the square brackets are reserved for the table key, so the name appears in a display form: a leading bracket pair is removed and any other square bracket becomes a parenthesis (Human rotavirus G4P(8)). The NCBI scientific name is in the JSON, the catalog index and on this page; the TaxID, the first part of the bracketed key, identifies the taxon.
Download the catalog index to list every table: taxid, scientific_name, compartment, genetic_code, source, cds and resource. A table’s files are at /classical/taxon/{taxid}/{compartment}-code{genetic_code}/{source}.txt (or .tsv, .json).
A table URL has this structure:
/classical/taxon/{taxid}/{compartment}-code{code}/{source}.html
For example: Homo sapiens · nuclear · code 1 · All. View links use #heatmap or #share; supported options are compare, aa, base and value in the query string.
Data and methods
Counting and clean CDS sets
CDS totals describe distinct CDS sequences in the selected table. For Raw CDS v3 clean nuclear tables, All uses the full S2 unique-CDS aggregate across sources; individual sources use their corresponding full S3 aggregates. Clean selection excludes partial CDS, pseudogenes, ambiguous bases, exceptions, slippage, artificial locations and lengths not divisible by three.
Where available, Records (n_records in JSON) is the corresponding clean nuclear S1 row count before sequence deduplication. It is not an unfiltered record count. A missing record count is not zero.
Mean CDS length is the total number of codons in the table divided by the number of distinct CDS sequences (identical sequences counted once), shown to two decimal places. Start and stop codons are included. Because each distinct sequence counts, tables that pool many genomes or transcript isoforms usually give higher values than a per-gene average.
Genetic-code assignments come from the selected precomputed table. A target-code table is not necessarily a grouping by every record’s own transl_table. Retained historical tables can have different earlier filters and code-inferred compartment groupings. Tables with fewer than 100 CDS show a small-sample warning.
Snapshots and provenance
The current site’s data version is CUTD-v0.1[beta]. This version label does not mean that every table was generated from the same original analysis batch. Comparisons should be interpreted with their source, compartment, genetic code and counting definitions in mind.
Use the data version and the exact table URL when recording a result. Public JSON identifies the table and its values; detailed upstream batch and filtering provenance is not included in the current public JSON, TXT or TSV downloads. Contact support if you need those details.
The catalog does not estimate missing tables by combining unrelated count vectors. Web interface versions, data versions and deployment versions describe different things.
Frequently asked questions
Why is my TaxID missing?
The catalog is a selected collection, not every TaxID in a source database. Try the full scientific name, choose a suggestion or inspect the catalog index. Searching a parent taxon does not aggregate its descendants.
Why can I not select a source or comparison?
A disabled source has no table for the selected compartment and code. Compare with is enabled only for All; the second taxon must be different and have an All table under the same genetic code. Missing data is not zero.
Why do All and RefSeq sometimes match?
Some underlying collections contain only RefSeq CDS. Their All and RefSeq sets can therefore be identical; this does not change the general definition of All.
Why are some heatmap cells gray?
Stops and single-codon amino acids under the table’s code are shown with a gray hatch. Under the standard code these amino acids are Met and Trp. Gray does not mean the codon has zero occurrences.
Why is Across sources missing?
It is shown for nuclear tables with an All reference and at least two compatible source tables having 100 or more CDS each. It is hidden for organelles, insufficient eligible sources or no family with a defined comparison range.
Can I submit a sequence for analysis?
The Classic Tables page displays precomputed tables. Browse, the site-wide Download page, Statistics, About and Tool1–Tool4 are reserved navigation entries. Table downloads are available from each table page.
Support
For questions about CUTD, email HE (at) nig.ac.jp, replacing (at) with @ and removing spaces.
When reporting an issue, include the copied page URL, TaxID, source, compartment, genetic code and data version. These details identify the table and supported view options you were using.
Back to top ↑